Bitcoin (BTC) nears the end of June and Q2 2026 threatening to lose $60,000 support — can RSI divergences save bulls?
Key points:
- Bitcoin RSI data is printing key bullish divergences that were absent from previous dips in 2026.
- Traders remain concerned about a support collapse as analysis makes a key 2022 bear-market comparison.
- Macro data hinges on the labor market and Iran peace deal, with a potential crypto tailwind due.
- Where June fails, July historically comes through for Bitcoin bulls.
- Onchain data sees Bitcoin’s “first bottoming flag” already present.
Bitcoin RSI divergence stands out in 2026 bear market
A classic BTC price leading indicator continues to boost the odds of a recovery as June comes to an end, TradingView data shows.
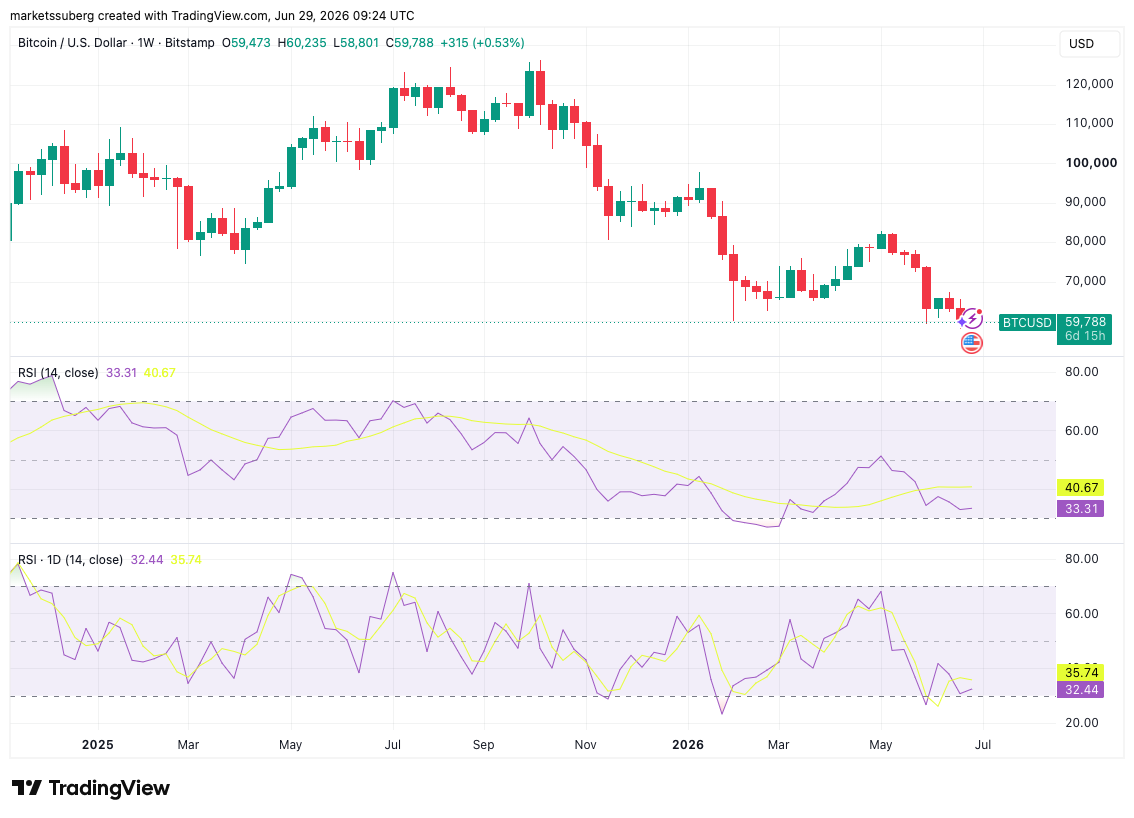
BTC/USD one-week chart with daily, weekly RSI. Source: Cointelegraph/TradingView
As Cointelegraph reported, relative strength index (RSI) cues across multiple time frames are locking in bullish divergences with price.
“$BTC is printing a bullish RSI divergence while a potential double bottom forms,” Bitcoin whale Gerla, owner of the Gerla trading group, told X followers about the four-hour chart on Sunday.
“This is getting interesting.”
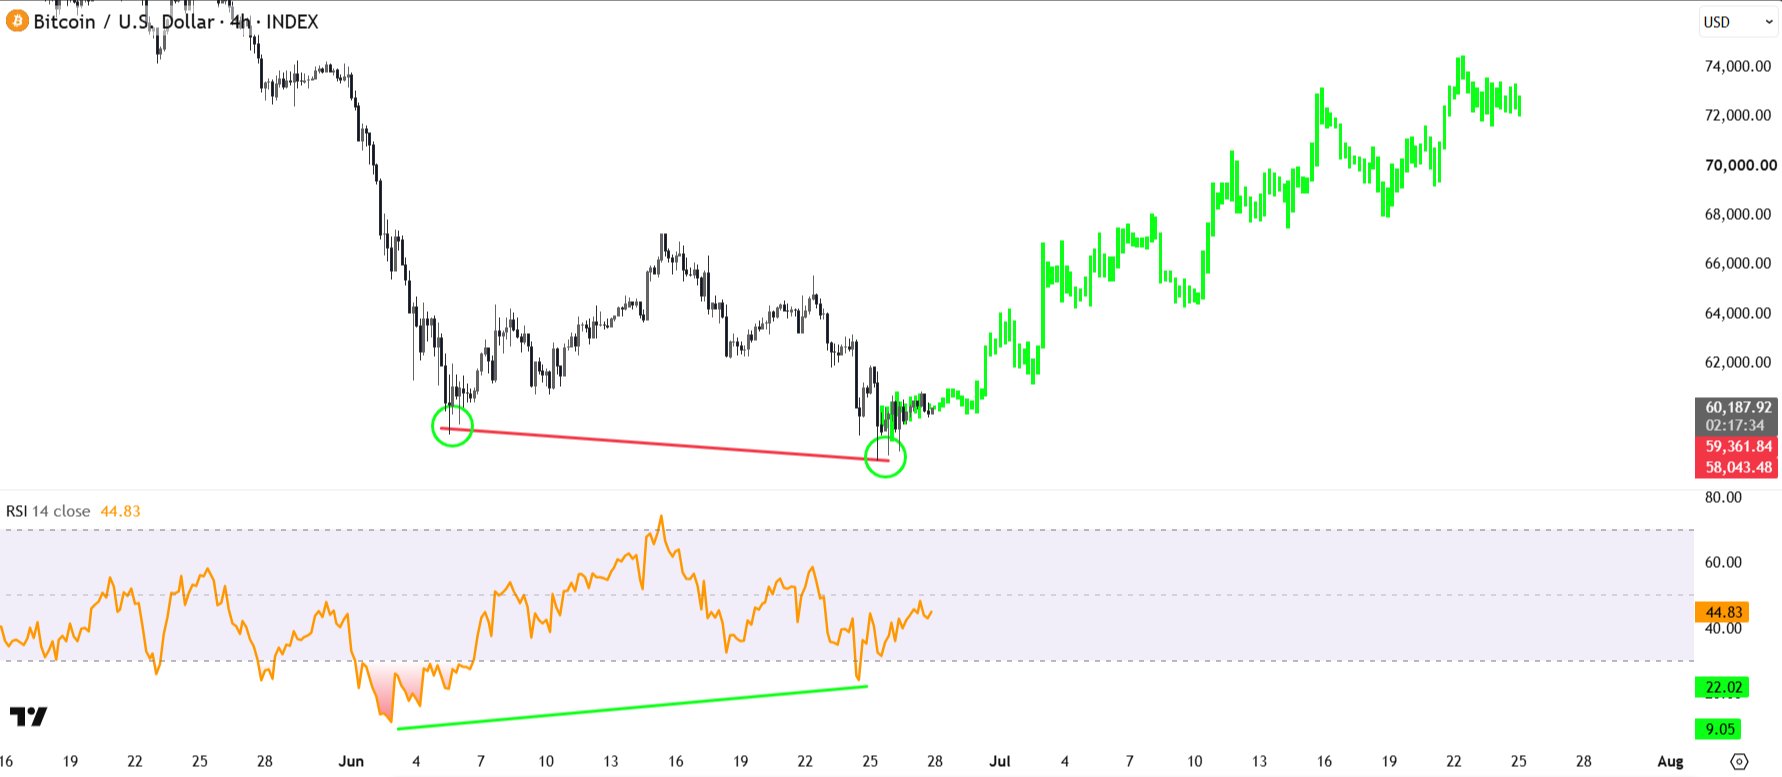
BTC/USD four-hour chart with RSI data. Source: Gerla/X
The sense of anticipation is increasing across the trading community, with pseudonymous trader and commentator Heisenberg noting a key divergence between Bitcoin’s latest macro lows and previous dips in 2026.
“Small sample size but still noteworthy. Notice the last two oversold RSI divergences (in orange) formed bottoms,” they wrote alongside a chart on X.
“The last two recent drops (in blue) had no RSI divergences… UNTIL NOW… Is this the one?”
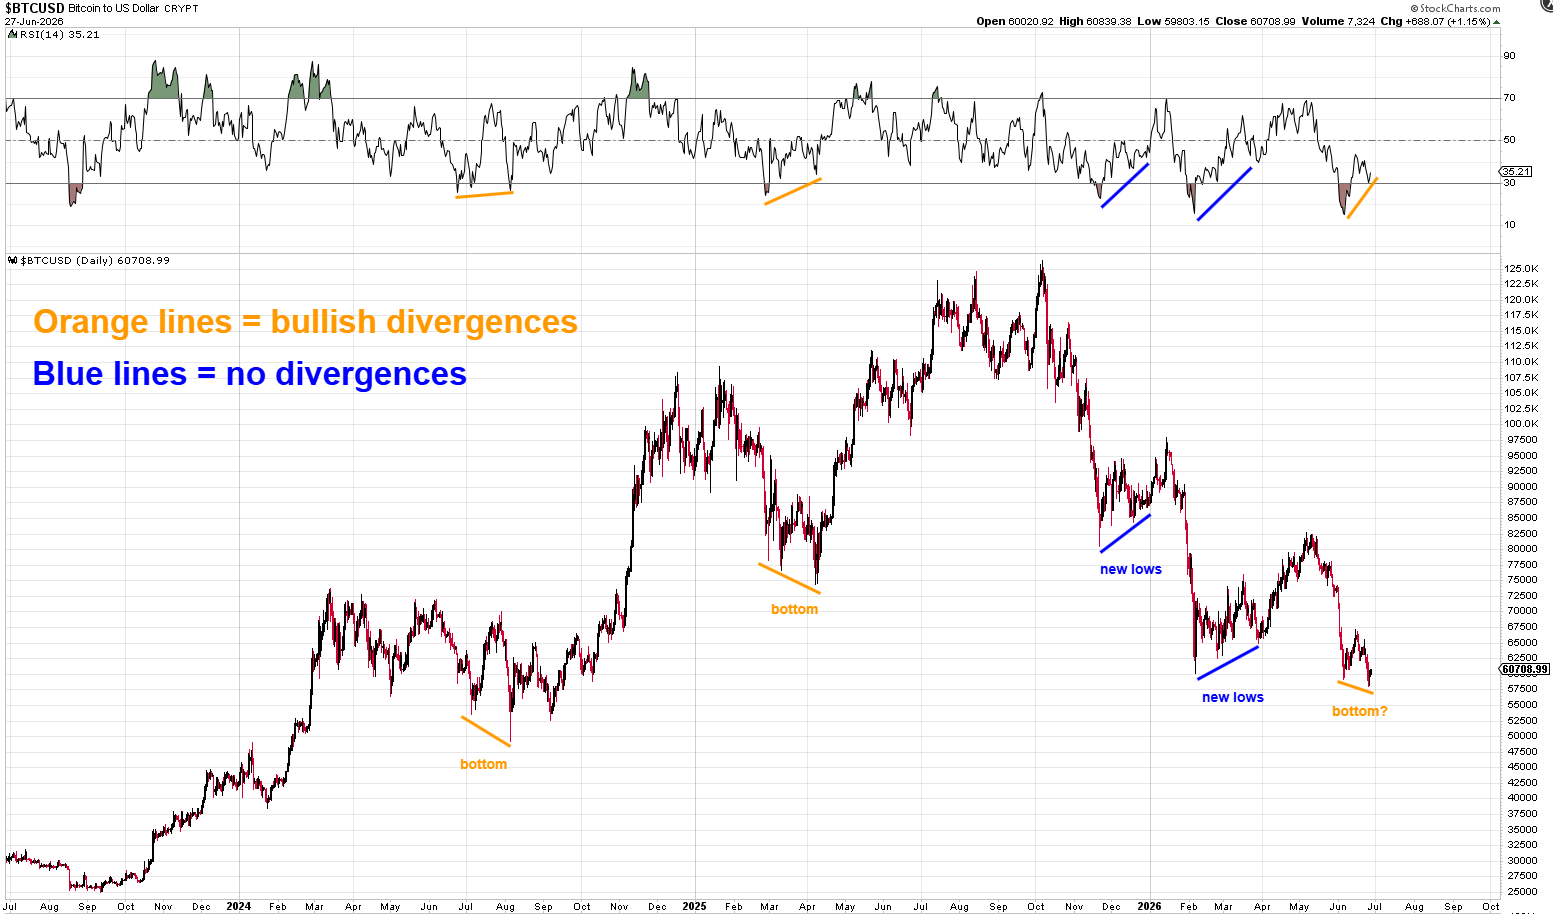
BTC/USD one-day chart with RSI data. Source: Heisenberg/X
RSI divergences have accompanied some of the most significant trend changes in Bitcoin history, including the end of its previous bear market in late 2022.
$60,000 sparks mid-2022 comparison
Bitcoin saw modest upside as the week began after sealing a weekly close below $59,500 — its first since September 2024. $60,000 is now increasingly acting as resistance, with bulls unable to exert significant momentum.
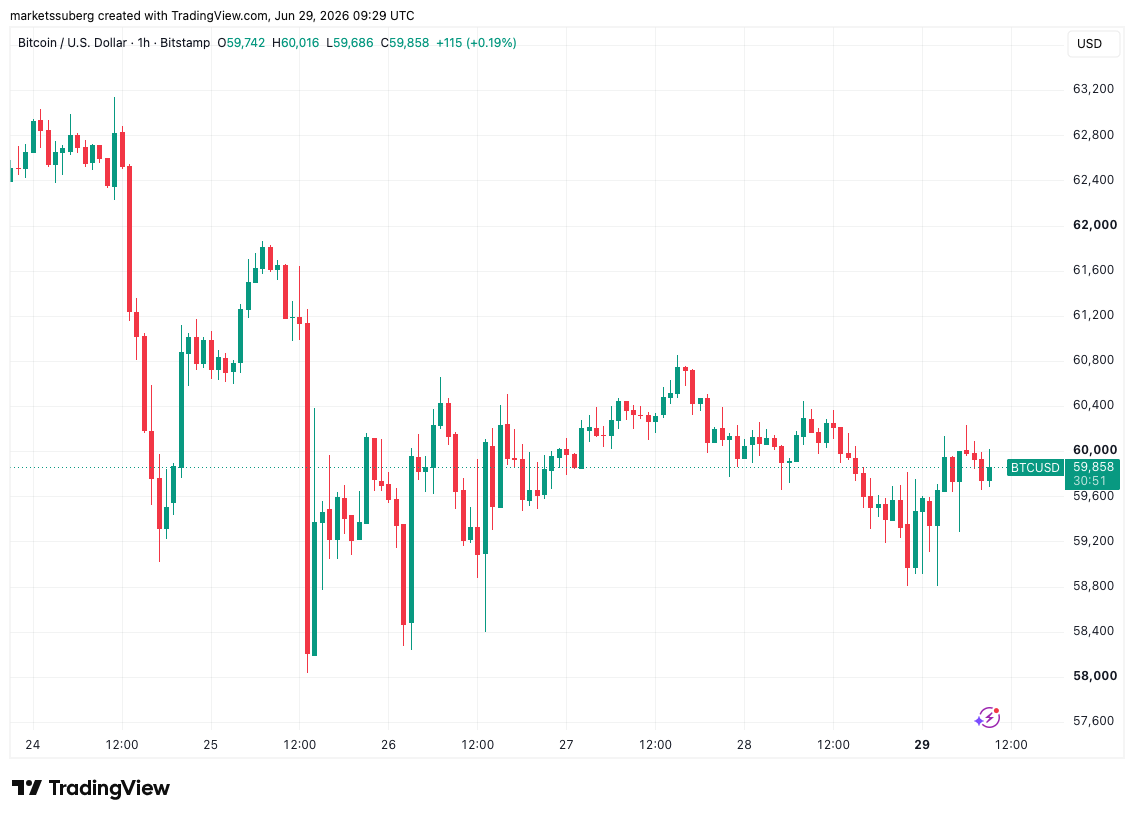
BTC/USD one-hour chart. Source: Cointelegraph/TradingView
“Quite funny enough, this is not a bad start of the week for Bitcoin as it bounces upwards,” crypto trader and analyst Michaël van de Poppe responded in his latest X analysis.
“We need to see way more momentum, and a clear break above $61,000, however, the bullish divergence is there and shouldn’t be ignored.”
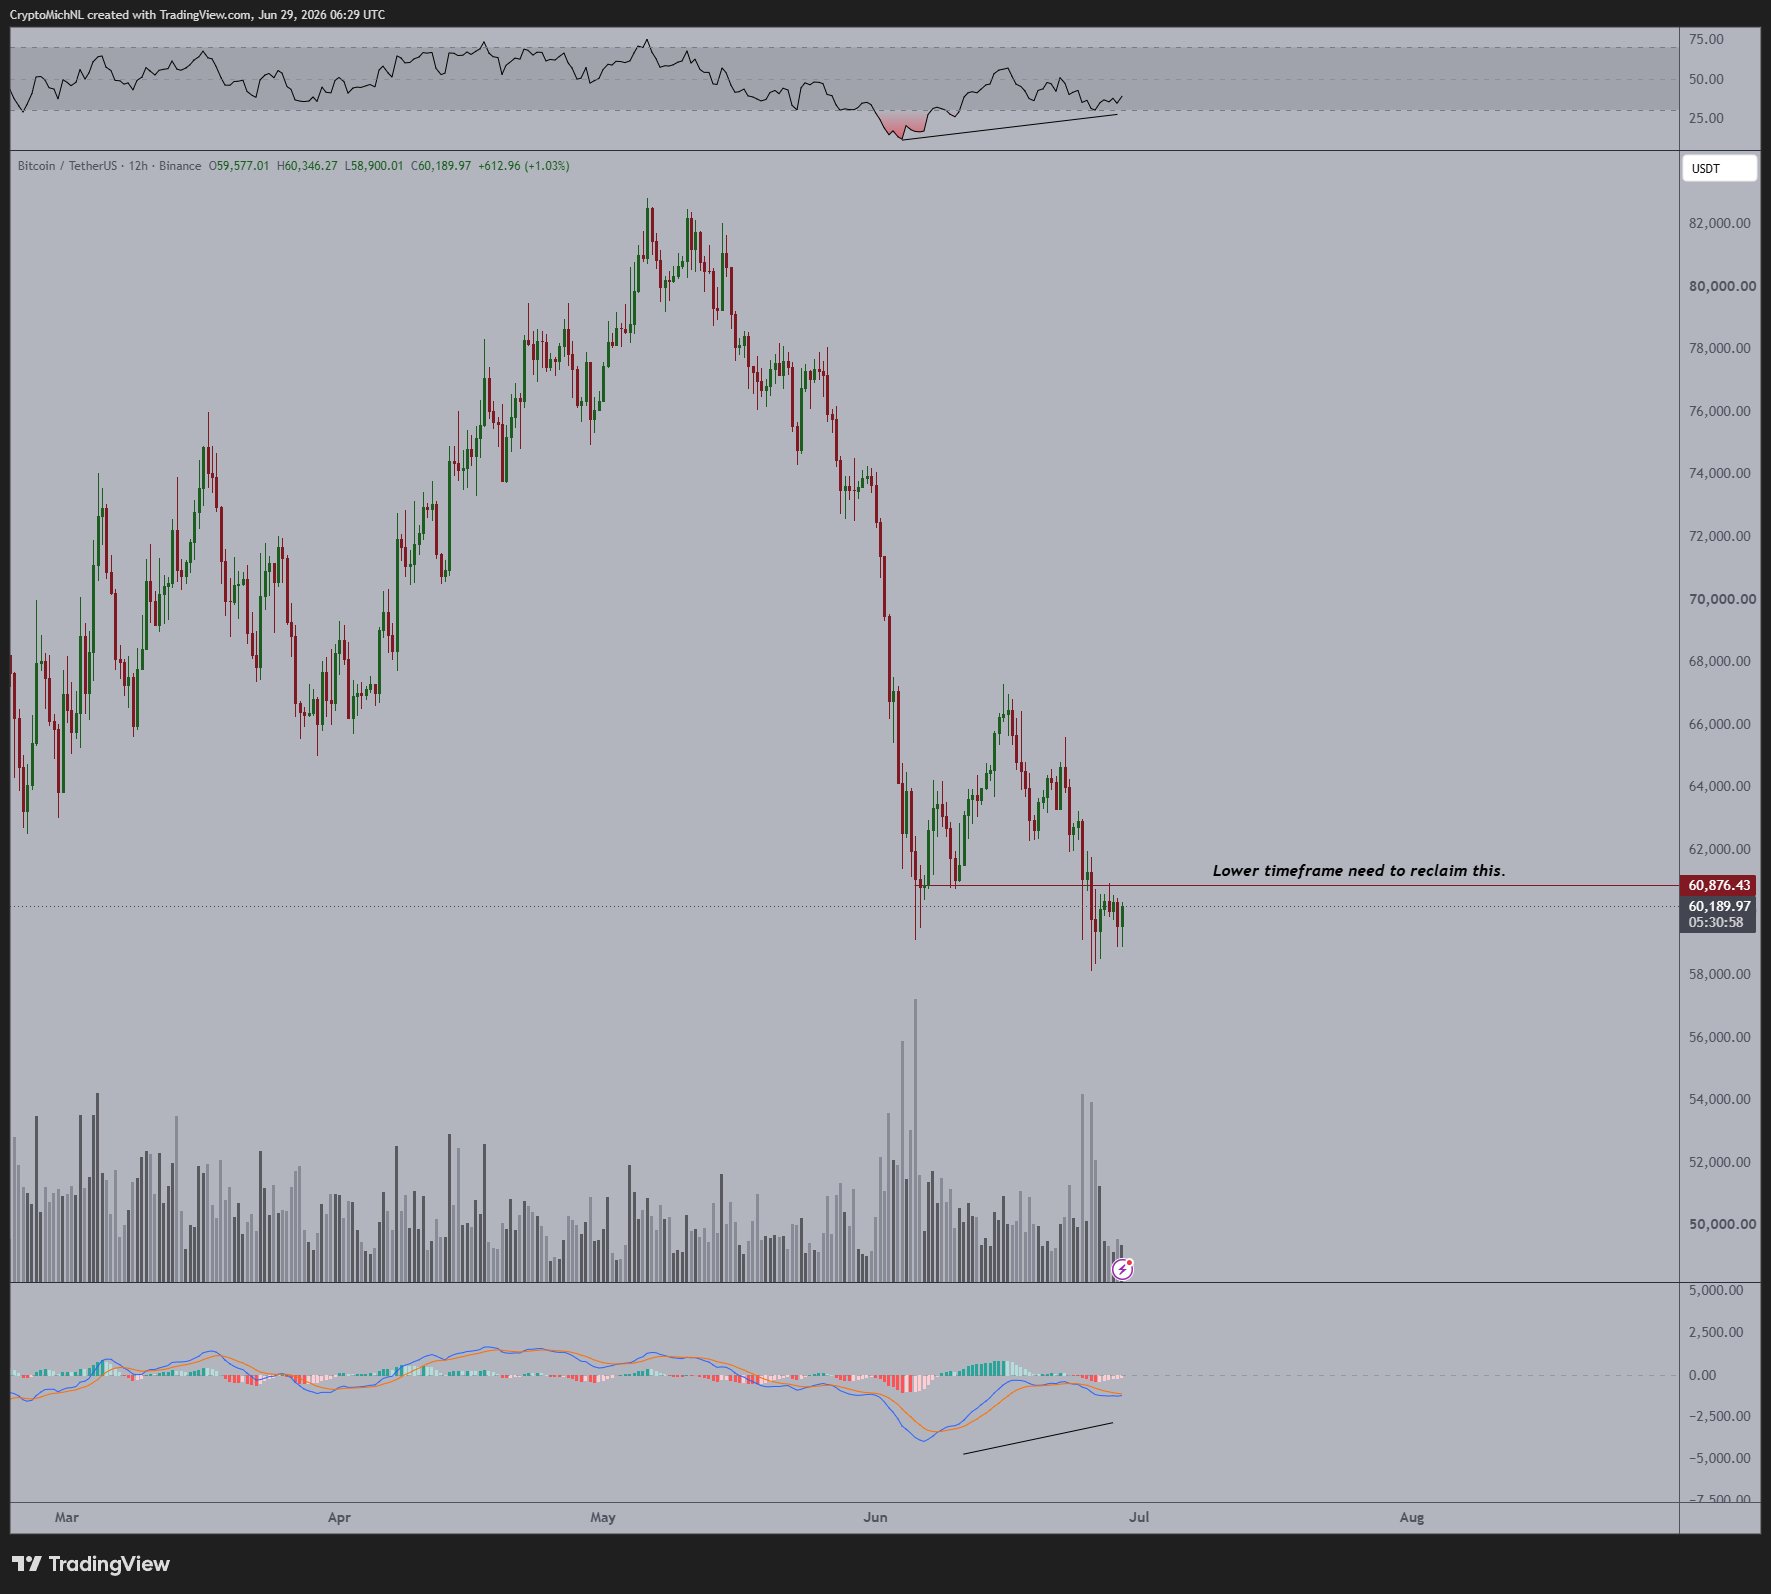
BTC/USDT 12-hour chart with RSI, volume, MACD data. Source: Michaël van de Poppe/X
With the monthly and quarterly closes approaching, trader Killa suggested that upcoming BTC price action would be particularly significant within the long-term trend.
“A few more days and $BTC reaches my 5th pivot. For the past 18+ months, we’ve consistently seen major directional shifts around this point at the start of each month,” the explained on Monday.
“Whether it’s a pivot low or a pivot high, this is a key time to start paying close attention.”
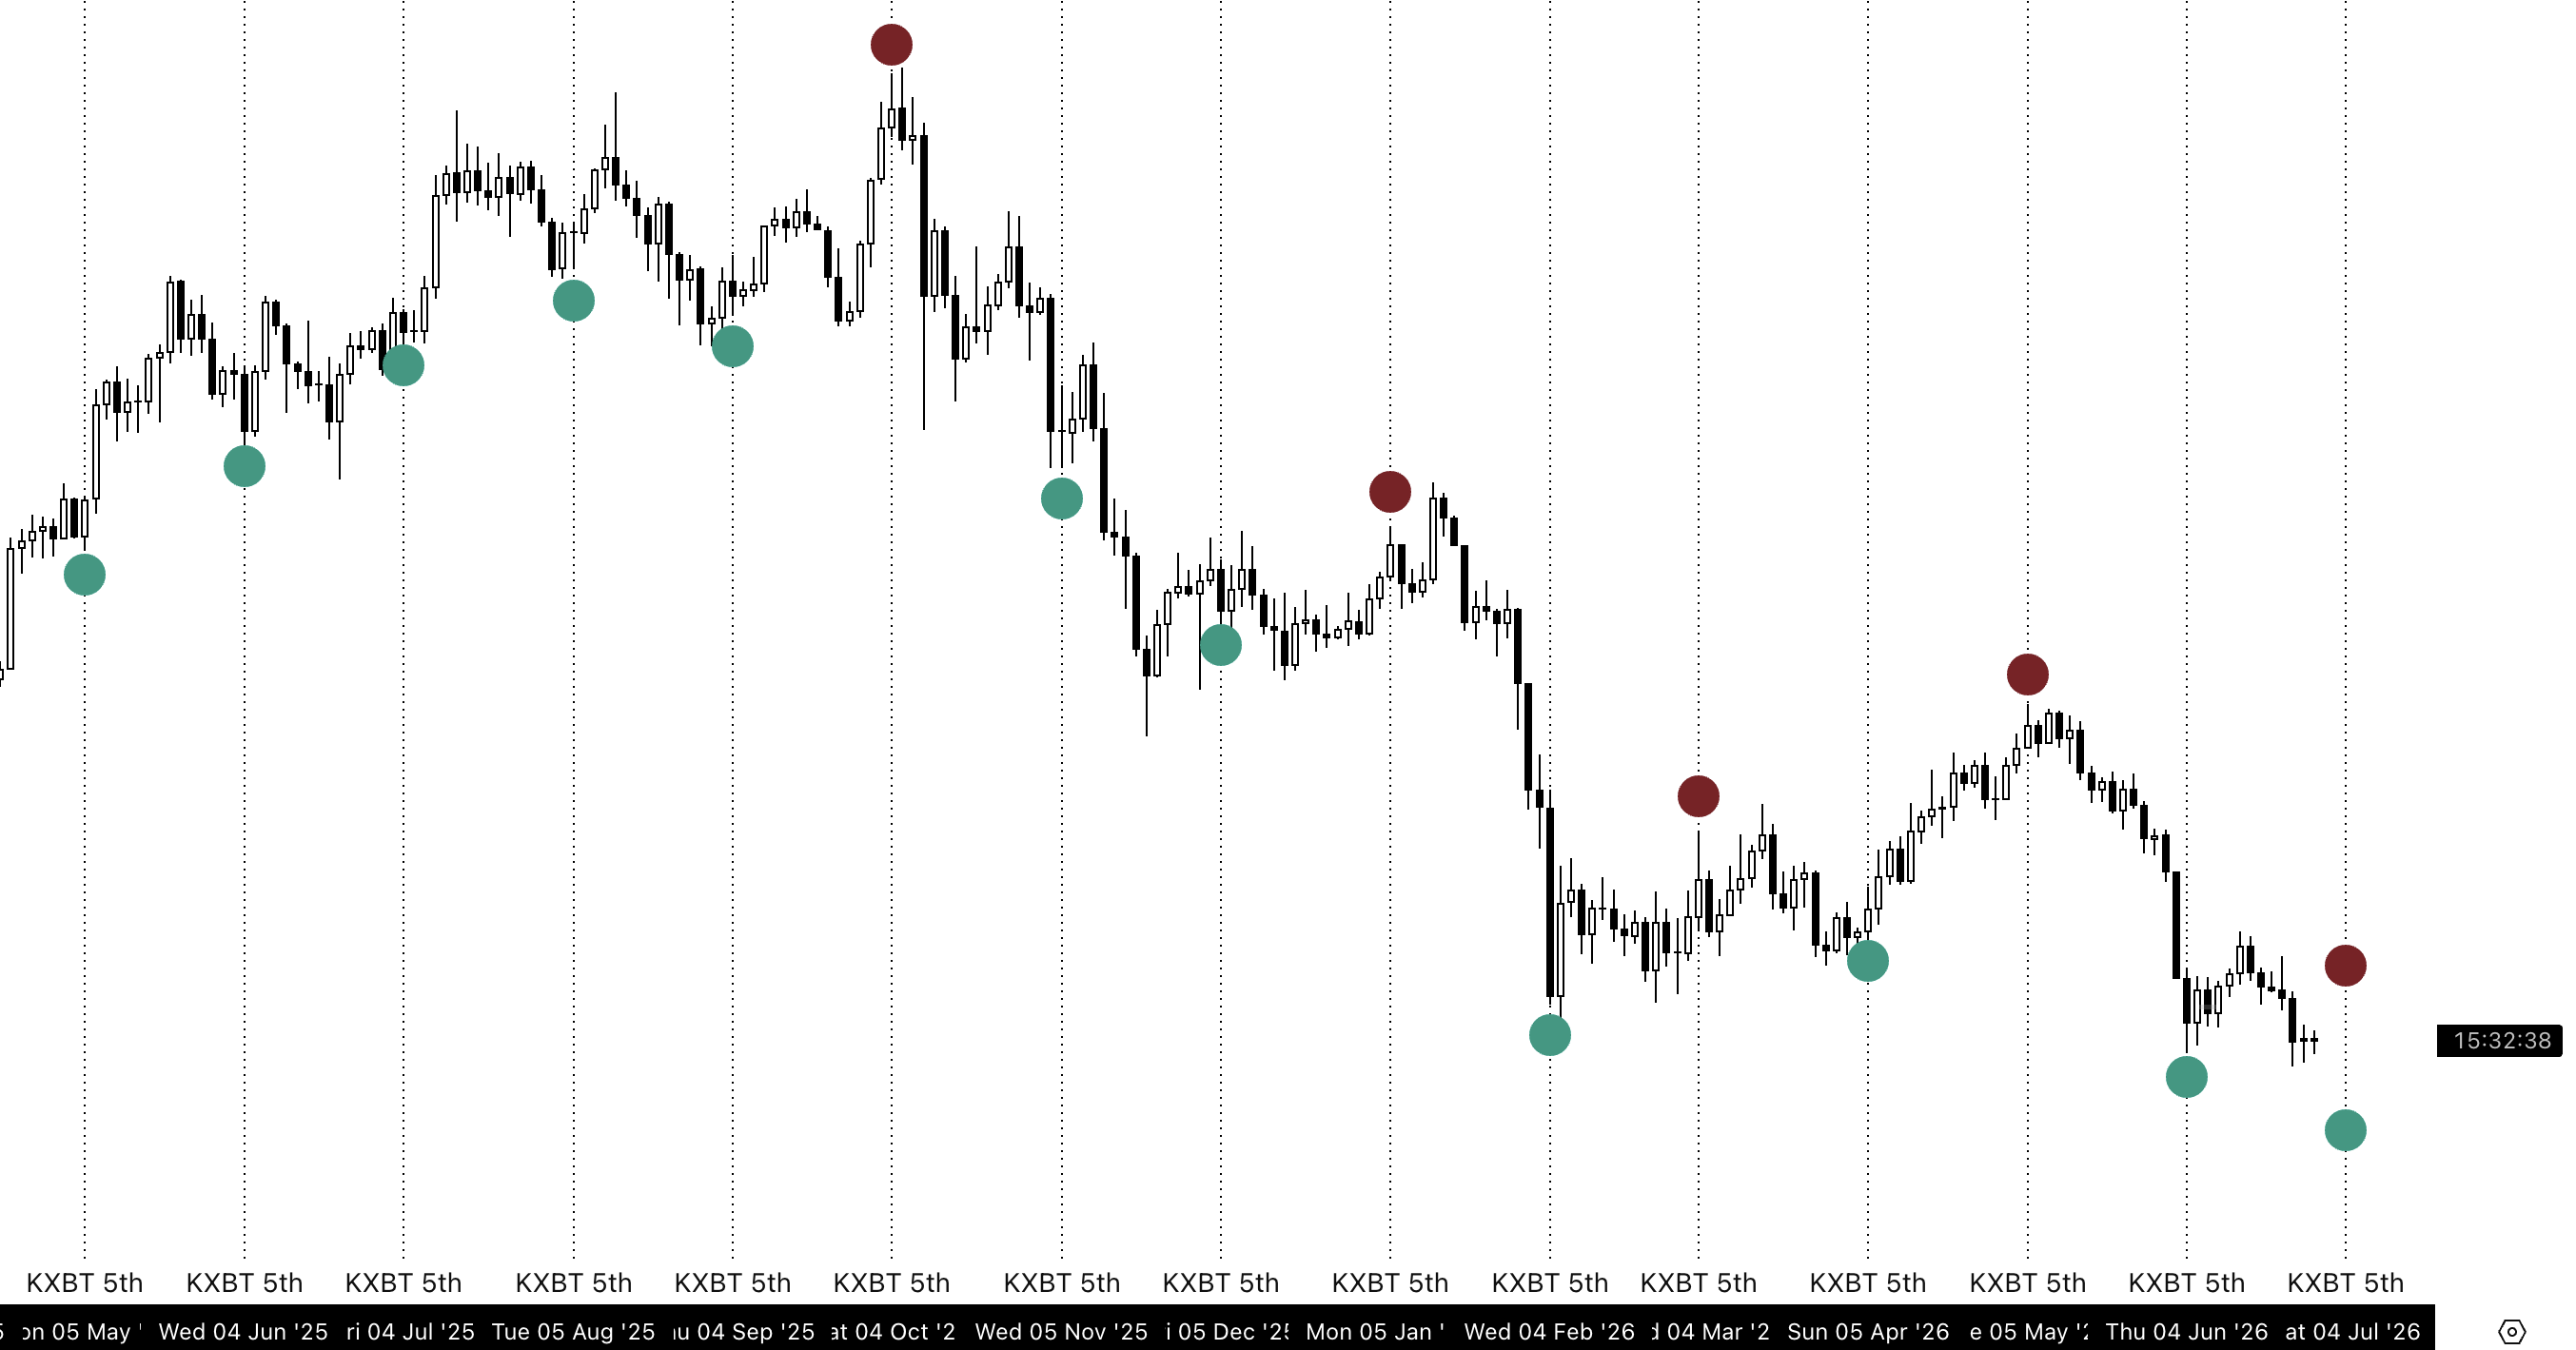
BTC/USD chart. Source: Killa/X
Data from monitoring resource CoinGlass puts June losses for BTC/USD at nearly 19% — the worst since the 2022 bear market and the sharpest of the year so far.
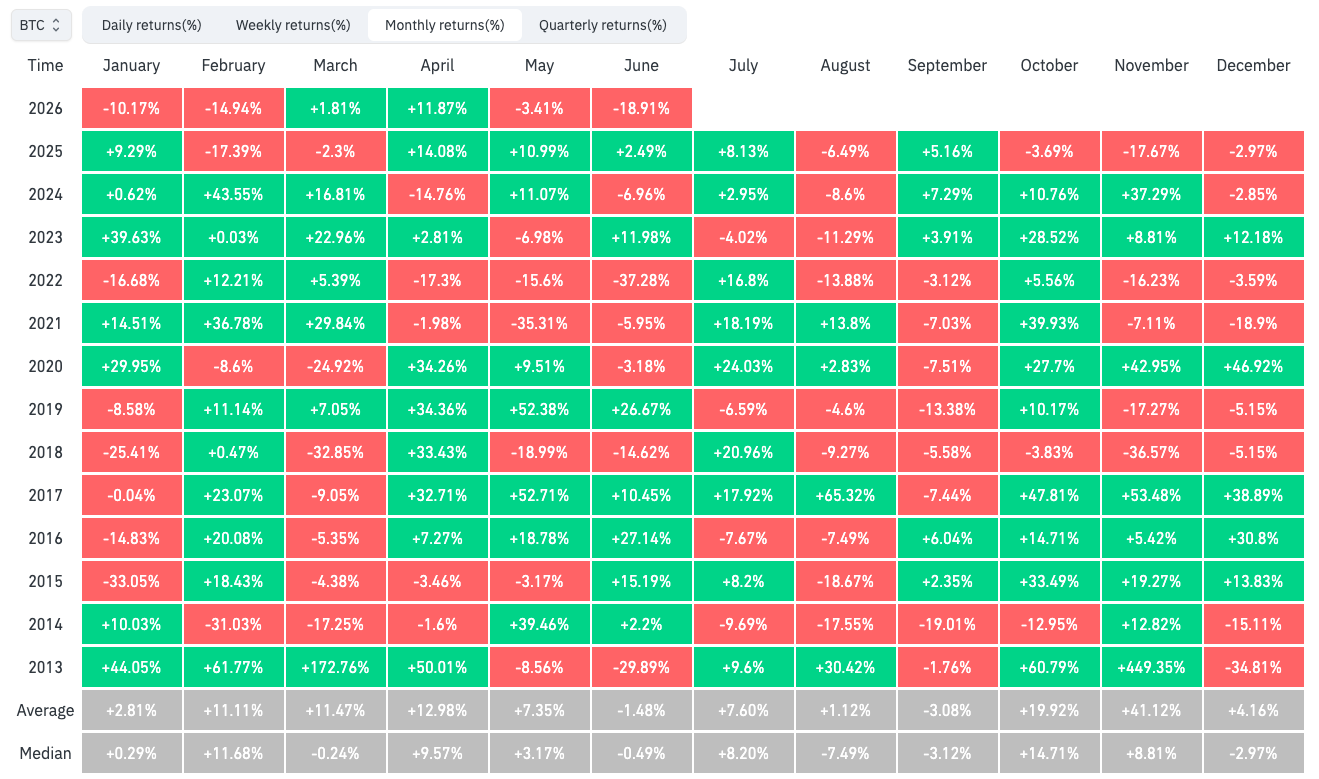
BTC/USD monthly returns (screenshot). Source: CoinGlass
On the fate of $60,000, meanwhile, commentator Exitpump argued that patience was required.
“Significant support and resistance levels rarely break on the first attempt. They usually require a lot of time, effort, and repeated tests before finally giving way,” they wrote at the weekend.
“60K now reminds me of 30K in 2022.”
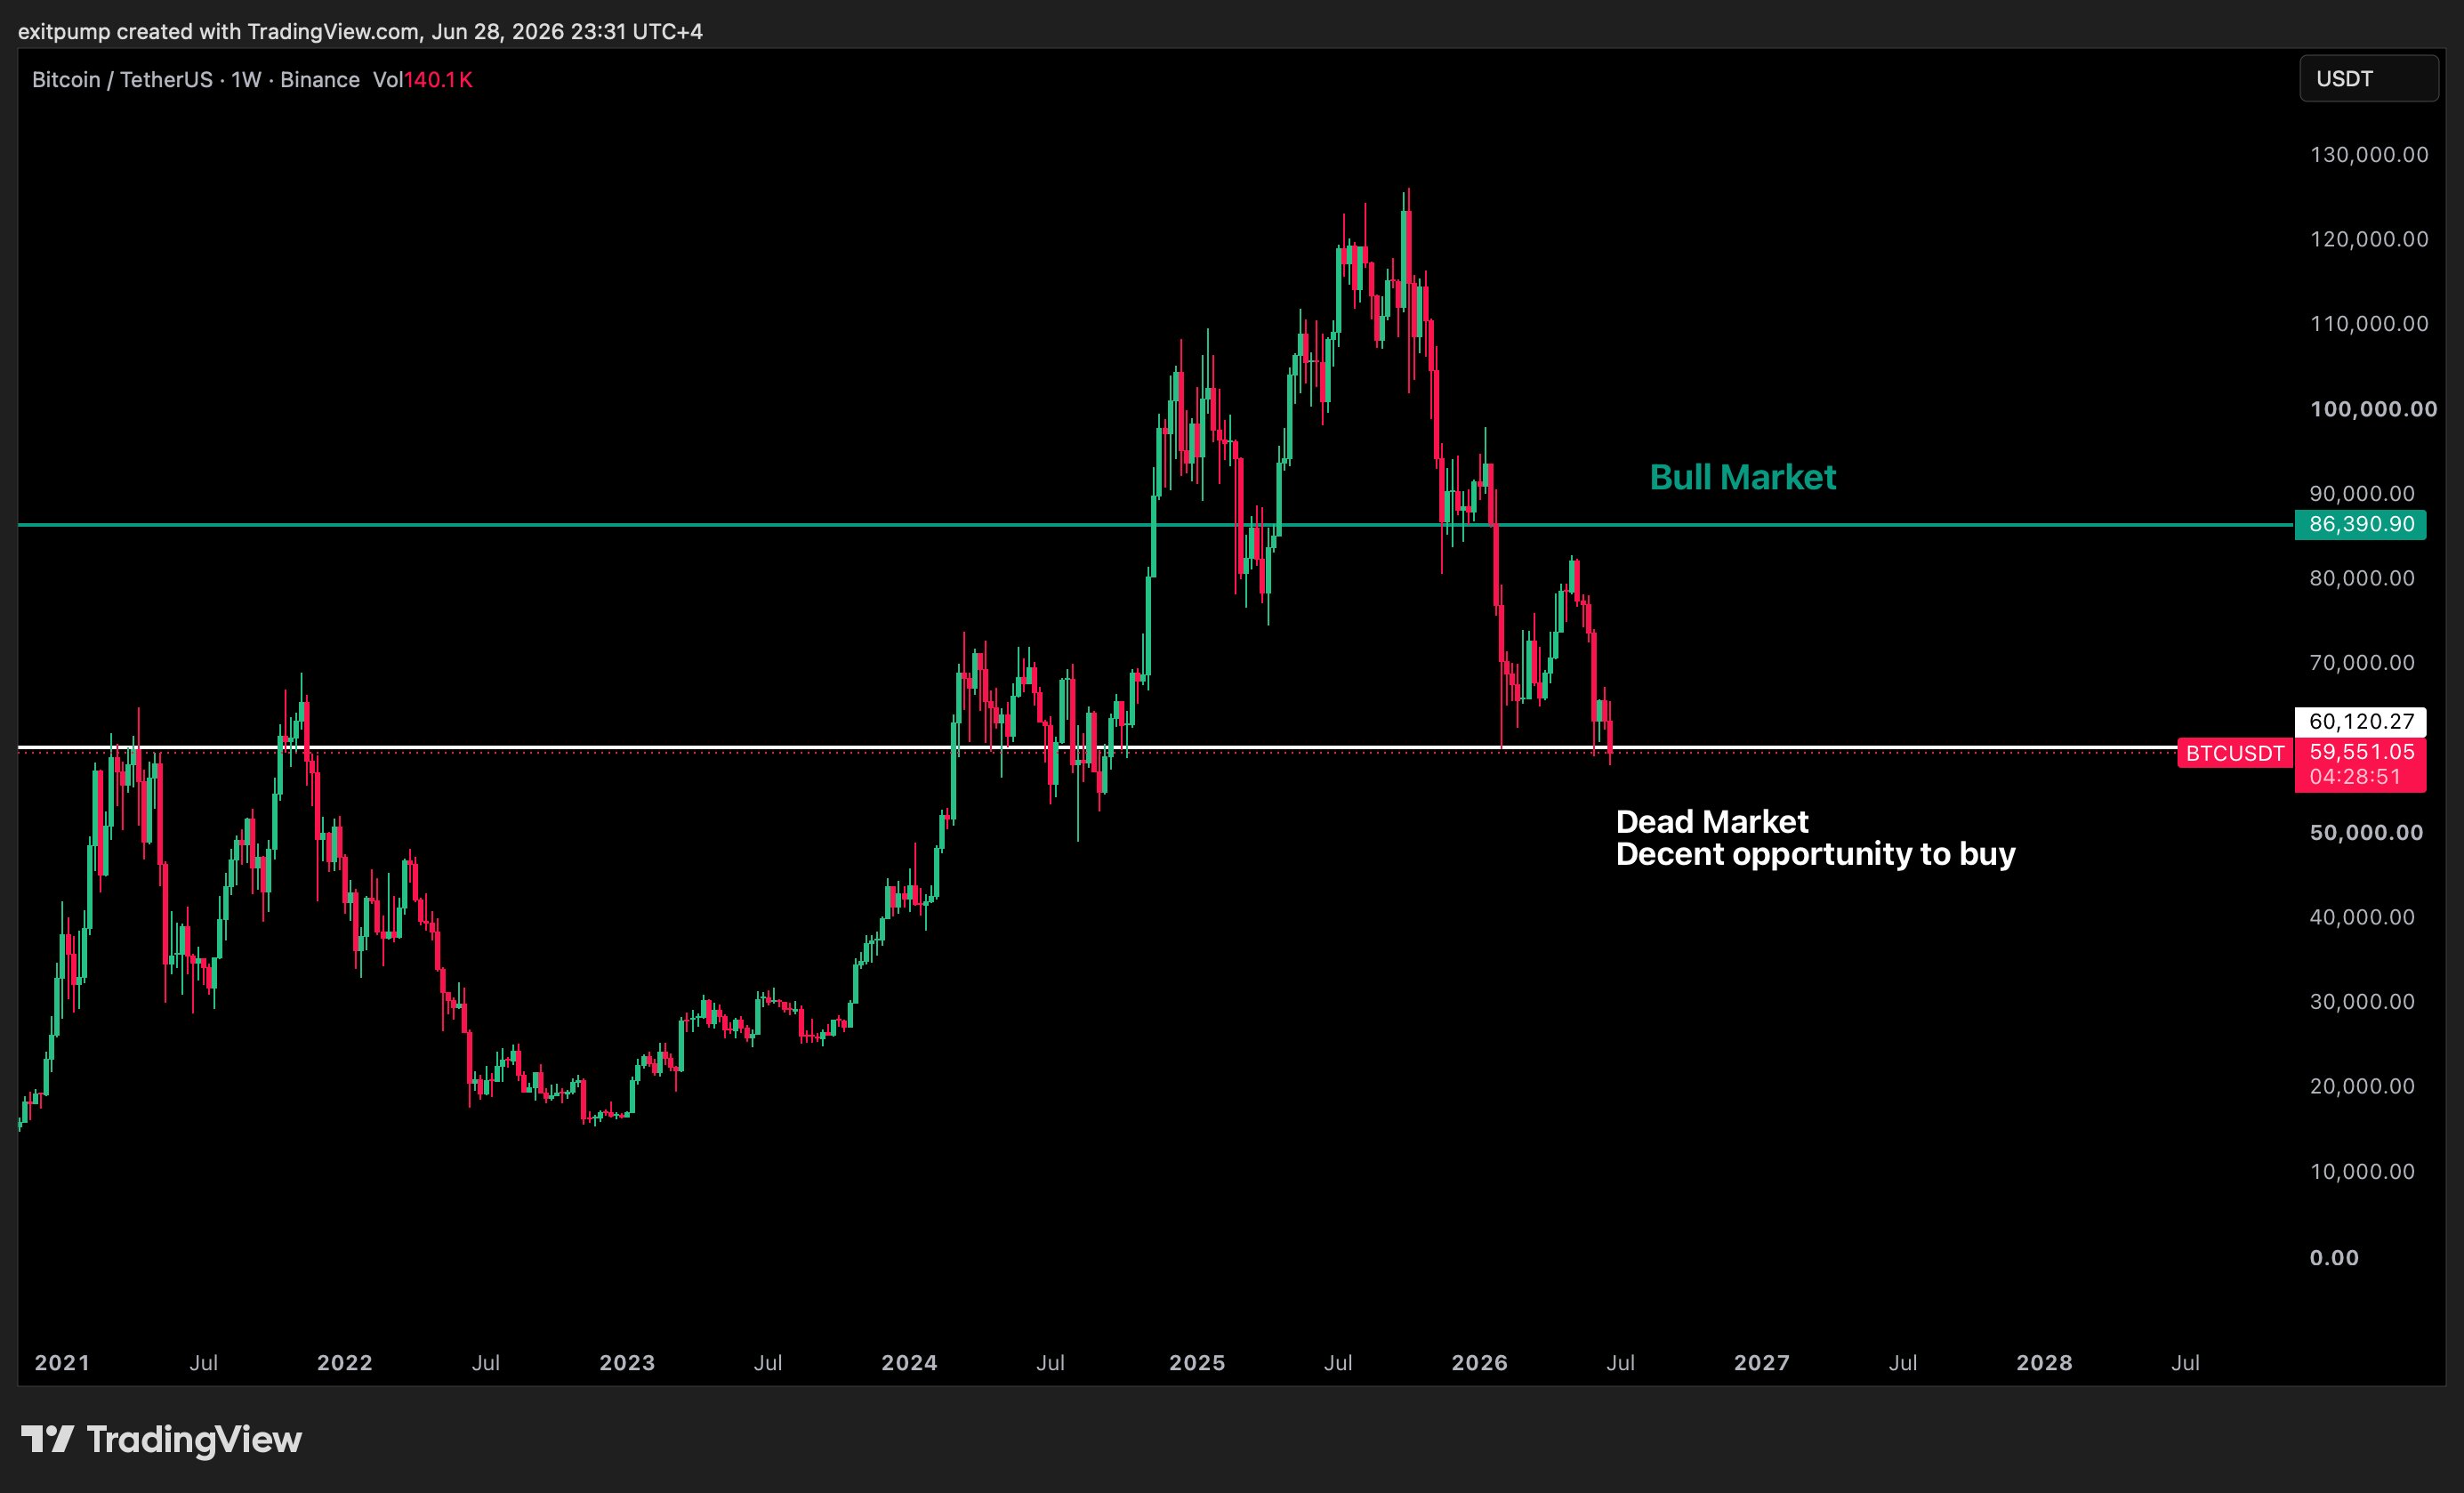
BTC/USDT one-week chart. Source: Exitpump/X
Bitcoin spent several months interacting with the $30,000 mark in mid-2022 before finally losing it as support, putting in its bear-market low around five months later.
To the upside, Exitpump expected that a “full blown bull market will be back” once $86,000 reappears.
PMI stands out for crypto in week’s macro prints
A mixed bag of US macro data makes for a “short but busy” four-day trading week to end Q2.
Wednesday will see the latest Manufacturing Purchasing Managers Index (PMI) report from the Institute of Supply Management (ISM) — a potential tailwind for crypto markets.
This continues its breakout from a multiyear downtrend, and estimates see bullish data continuing with a score of around 54, albeit with a potential mild decrease versus last month.
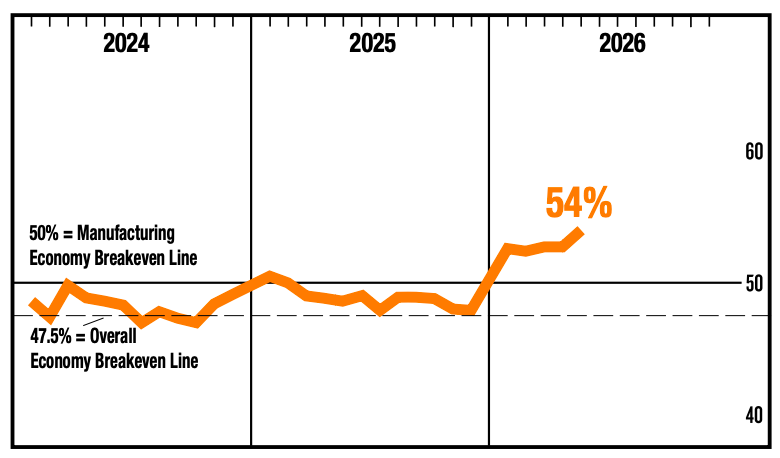
US manufacturing PMI data (screenshot). Source: ISM
Another focus is the labor market as the market reacts to various employment numbers, including the June nonfarm payrolls report on Thursday.
“We have a short but busy week ahead,” trading resource The Kobeissi Letter summarized in a thread on X.
Kobeissi noted that the week would start with a reaction to geopolitical developments as the US and Iran agree to discuss their fragile peace agreement.
“This week also marks the end of Q2 2026 with earnings season on the horizon,” it added.
In the latest edition of its regular newsletter, The Market Mosaic, trading resource Mosaic Asset Company suggested that seasonality could boost stocks next.
“The S&P 500 is about to enter one of the best months of the year for calendar seasonality,” it explained.
“While weakness in the back half of June is common, July ranks as the best performing month based on data going back nearly 100 years.”
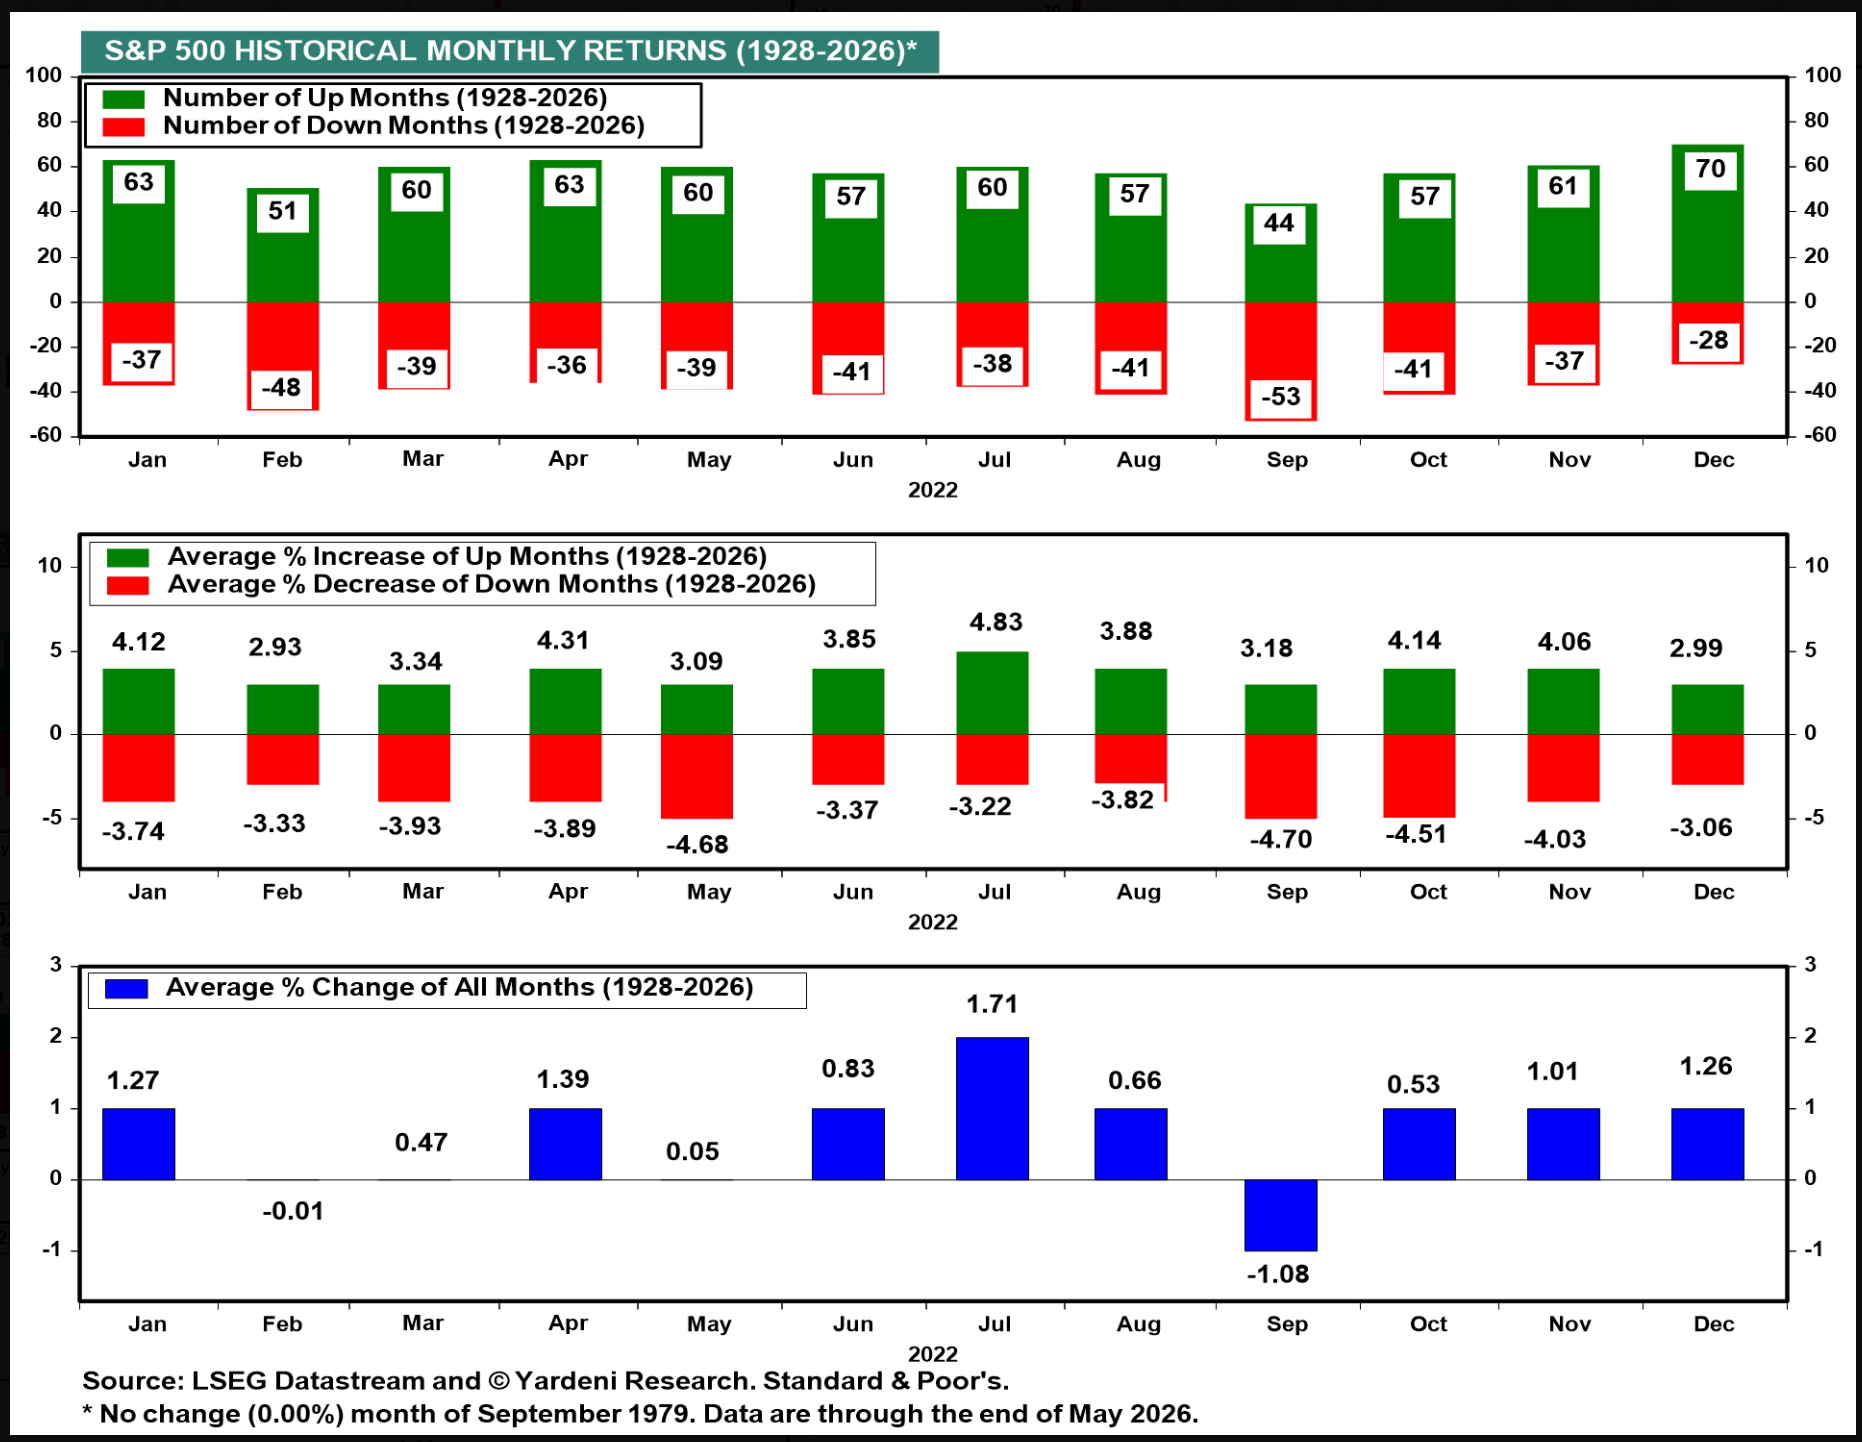
S&P 500 seasonality data. Source: Mosaic Asset Company
Bitcoin has seen mixed correlation activity versus equities in recent months, with even crypto-industry analysis calling the BTC-tech stock relationship “overblown.”
“$BTC vs S&P 500 back at the level it held during the Yen Carry trade blowup and the initial June low,” trader Daan Crypto Trades observed this weekend, referring to BTC price downside triggers over the past year.
“If you believe in people trading relative values or ratios on different assets, then you will see that this is an important level to hold for $BTC relative to stocks. Because down here there is not much support left until you’re at the late 2023 pre spot ETF rally levels.”
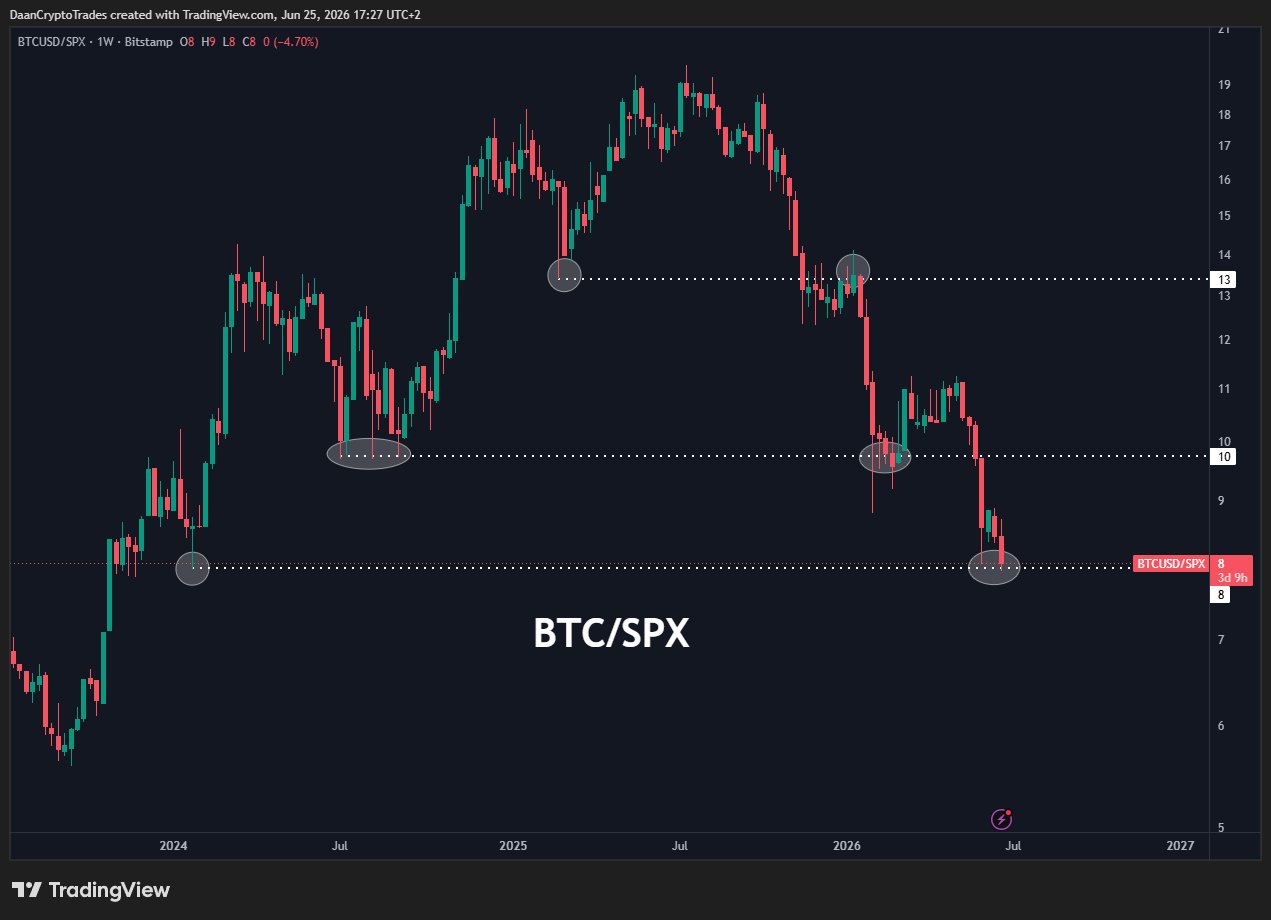
BTC/USD vs. S&P 500 one-week chart. Source: Daan Crypto Trades/X
Analysis expects July BTC price relief
While a copycat move by Bitcoin in the face of a stocks rebound is anything but guaranteed, history favors a return to strength as July begins.
Recent research by trader and analyst Rekt Capital reveals that in previous years, July price performance tends to offer a counterpoint to what occurred in June.
“If history repeats for Bitcoin, then the pattern may be as follows for next couple of months: June ends as a red month, July could be green in response, And August could therefore be red to cancel out July’s upside completely,” he told X followers last week.
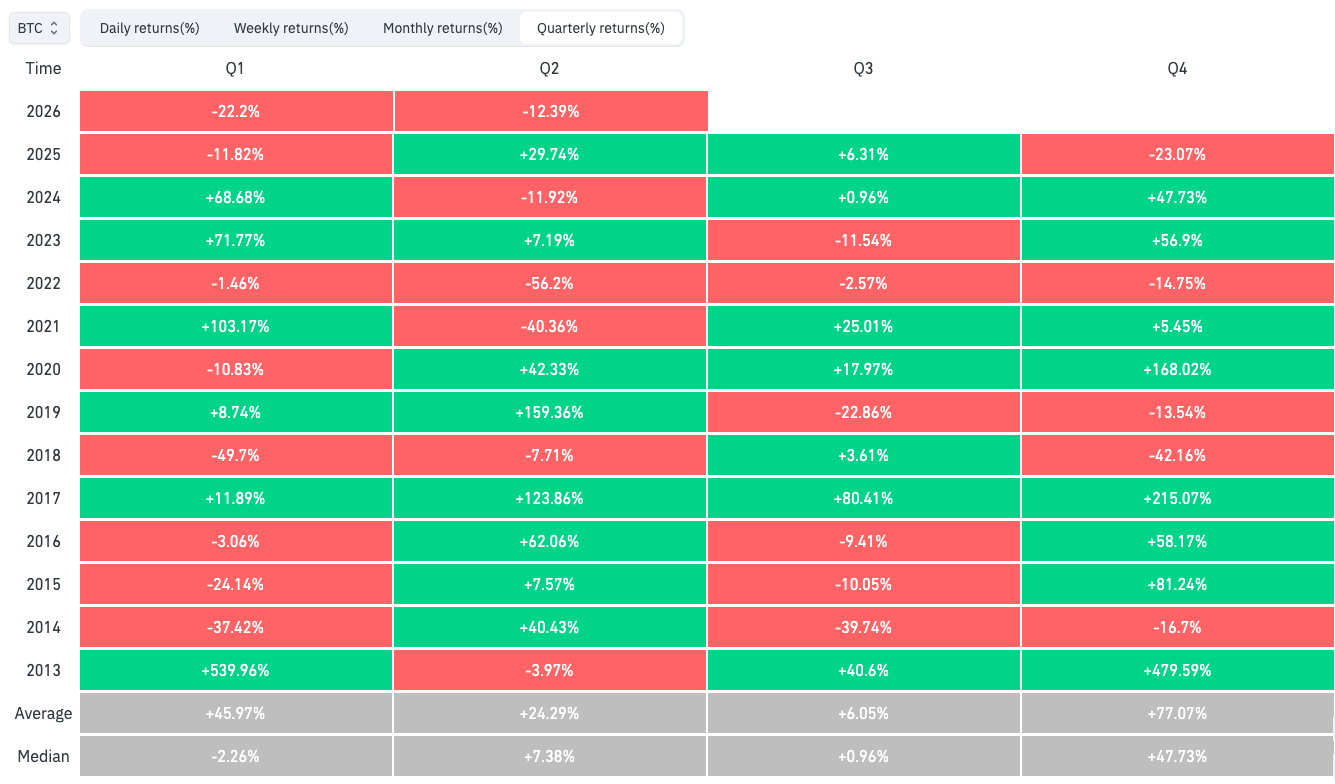
BTC/USD quarterly returns (screenshot). Source: CoinGlass
CoinGlass data confirms the divergence between June and July moves, with only three exceptions since 2013. Among them is 2025, when BTC/USD finished both months in the green.
So far this year, the pair is down 18.4% in June, its worst performance since the 2022 bear market.
As Cointelegraph reported, Rekt Capital believes that the latest bear trend still has months left to play out, with new lows possible as a result before a long-term floor is in. A chart uploaded to X put the bear market as 71% complete as of June 22.
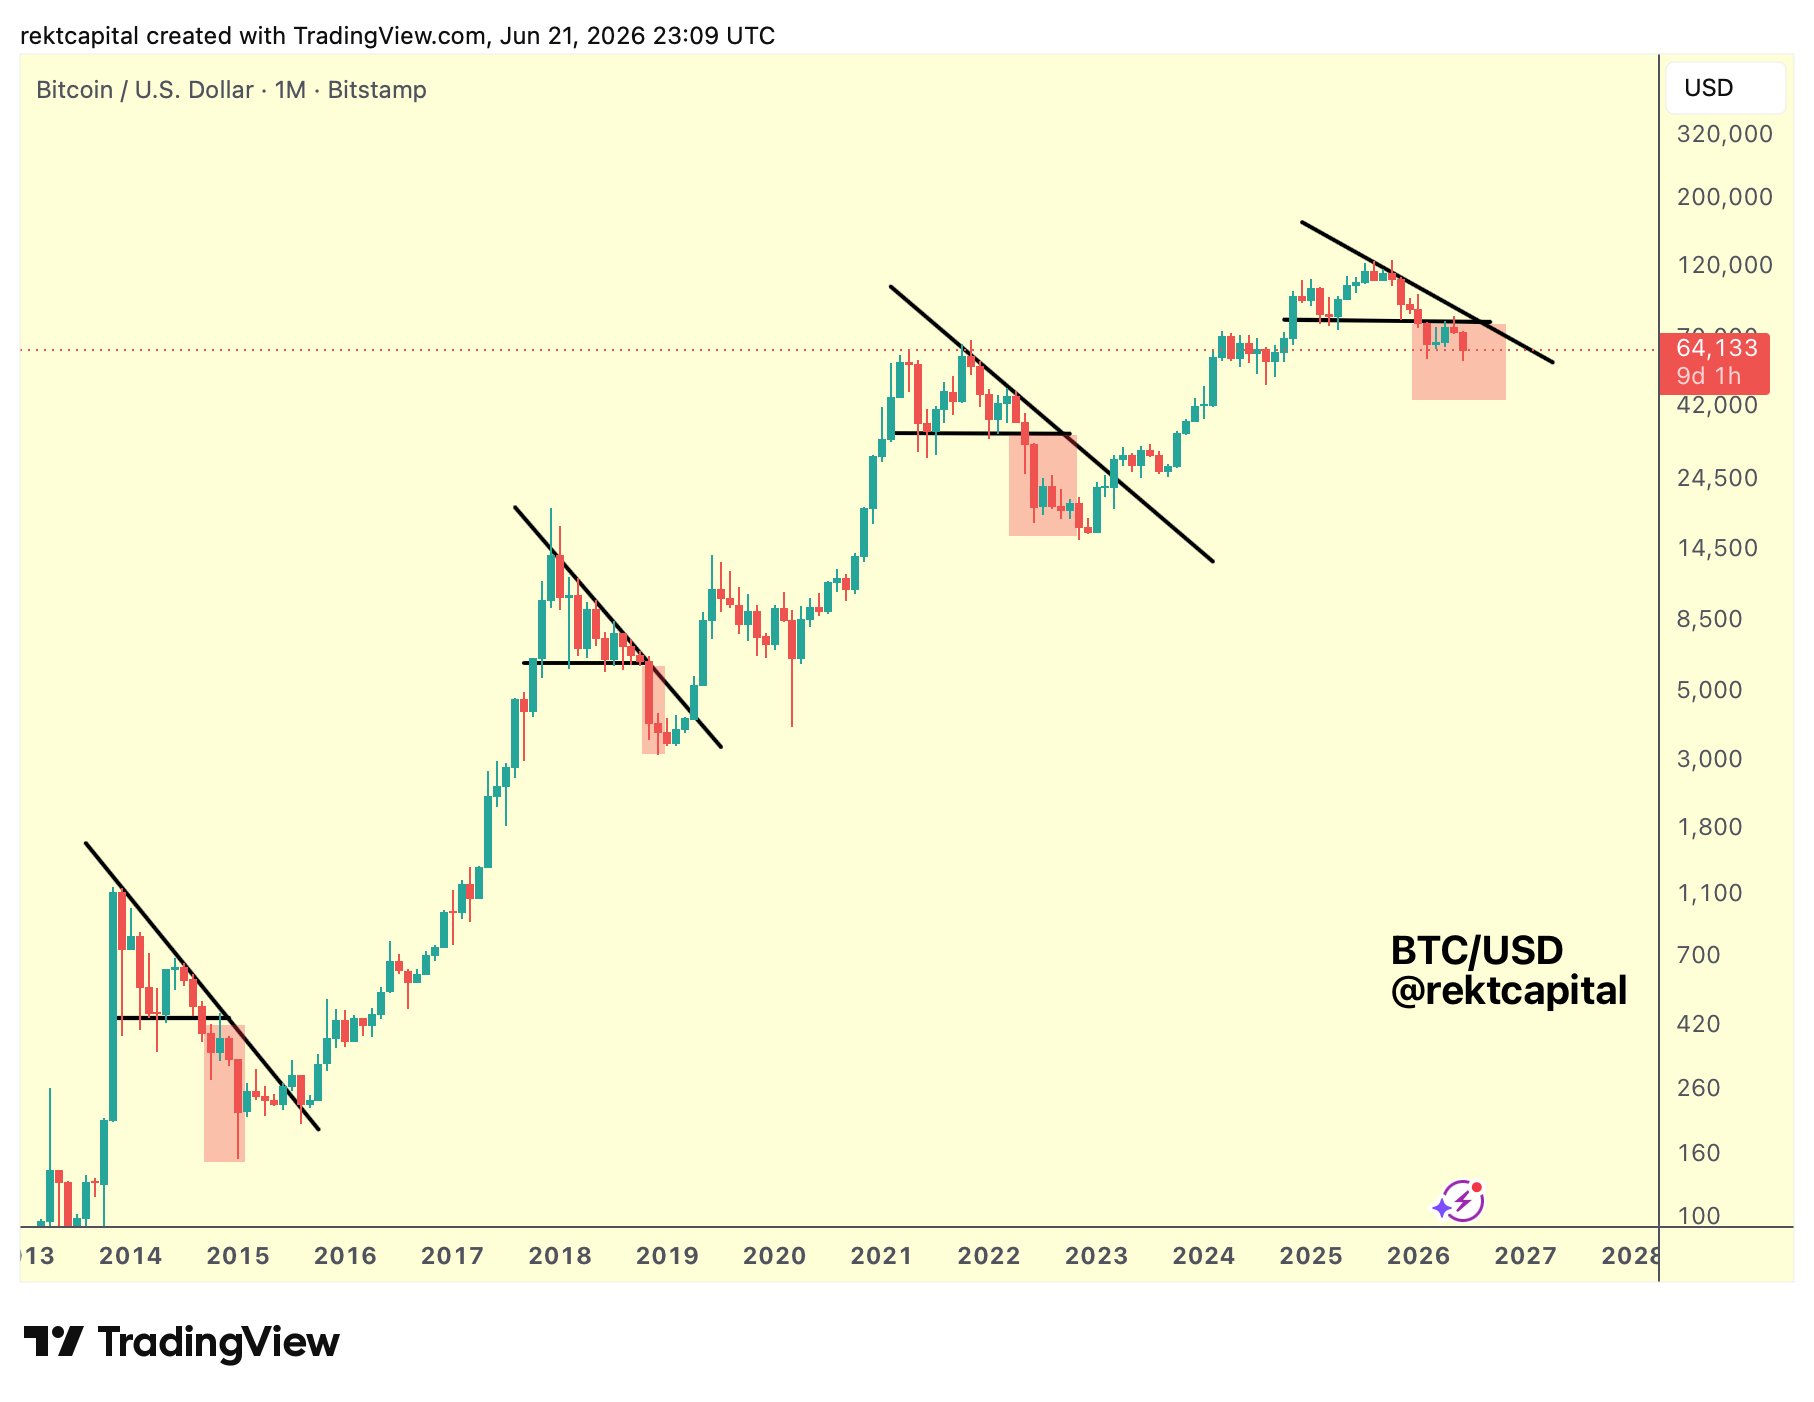
BTC/USD one-month chart. Source: Rekt Capital/X
Bitcoin metric produces “first bottoming flag”
Opinions still differ when it comes to whether Bitcoin has already seen its bear-market bottom.
Related: Bitcoin falls under $60K, but traders anticipate 15% bounce
As Cointelegraph continues to report, market participants broadly agree that more progress is required before a convincing downtrend reversal enters.
In its latest research, onchain analytics platform CryptoQuant adds to that consensus — but with an early silver lining for Bitcoin bulls.
“Bitcoin is starting to show the first clear sign of a deeper market clean-up,” contributor I. Moreno wrote in a QuickTake blog post on Sunday.
Moreno referenced a lesser-known onchain indicator, the UTXO Block P/L Count Ratio Model. This compares the aggregate profitability of blocks of unspent transaction outputs, or UTXOs.
“In simple terms, it measures how broad the market’s profit base is beneath price. When the ratio is high, most UTXO blocks remain in profit. That usually reflects a market still carrying a large amount of unrealized gains, which also means higher distribution risk,” the post explains.
“When the ratio collapses toward the lower range, the opposite happens: profitability compresses, losses become more widespread, and the market starts moving into a more advanced reset phase.”
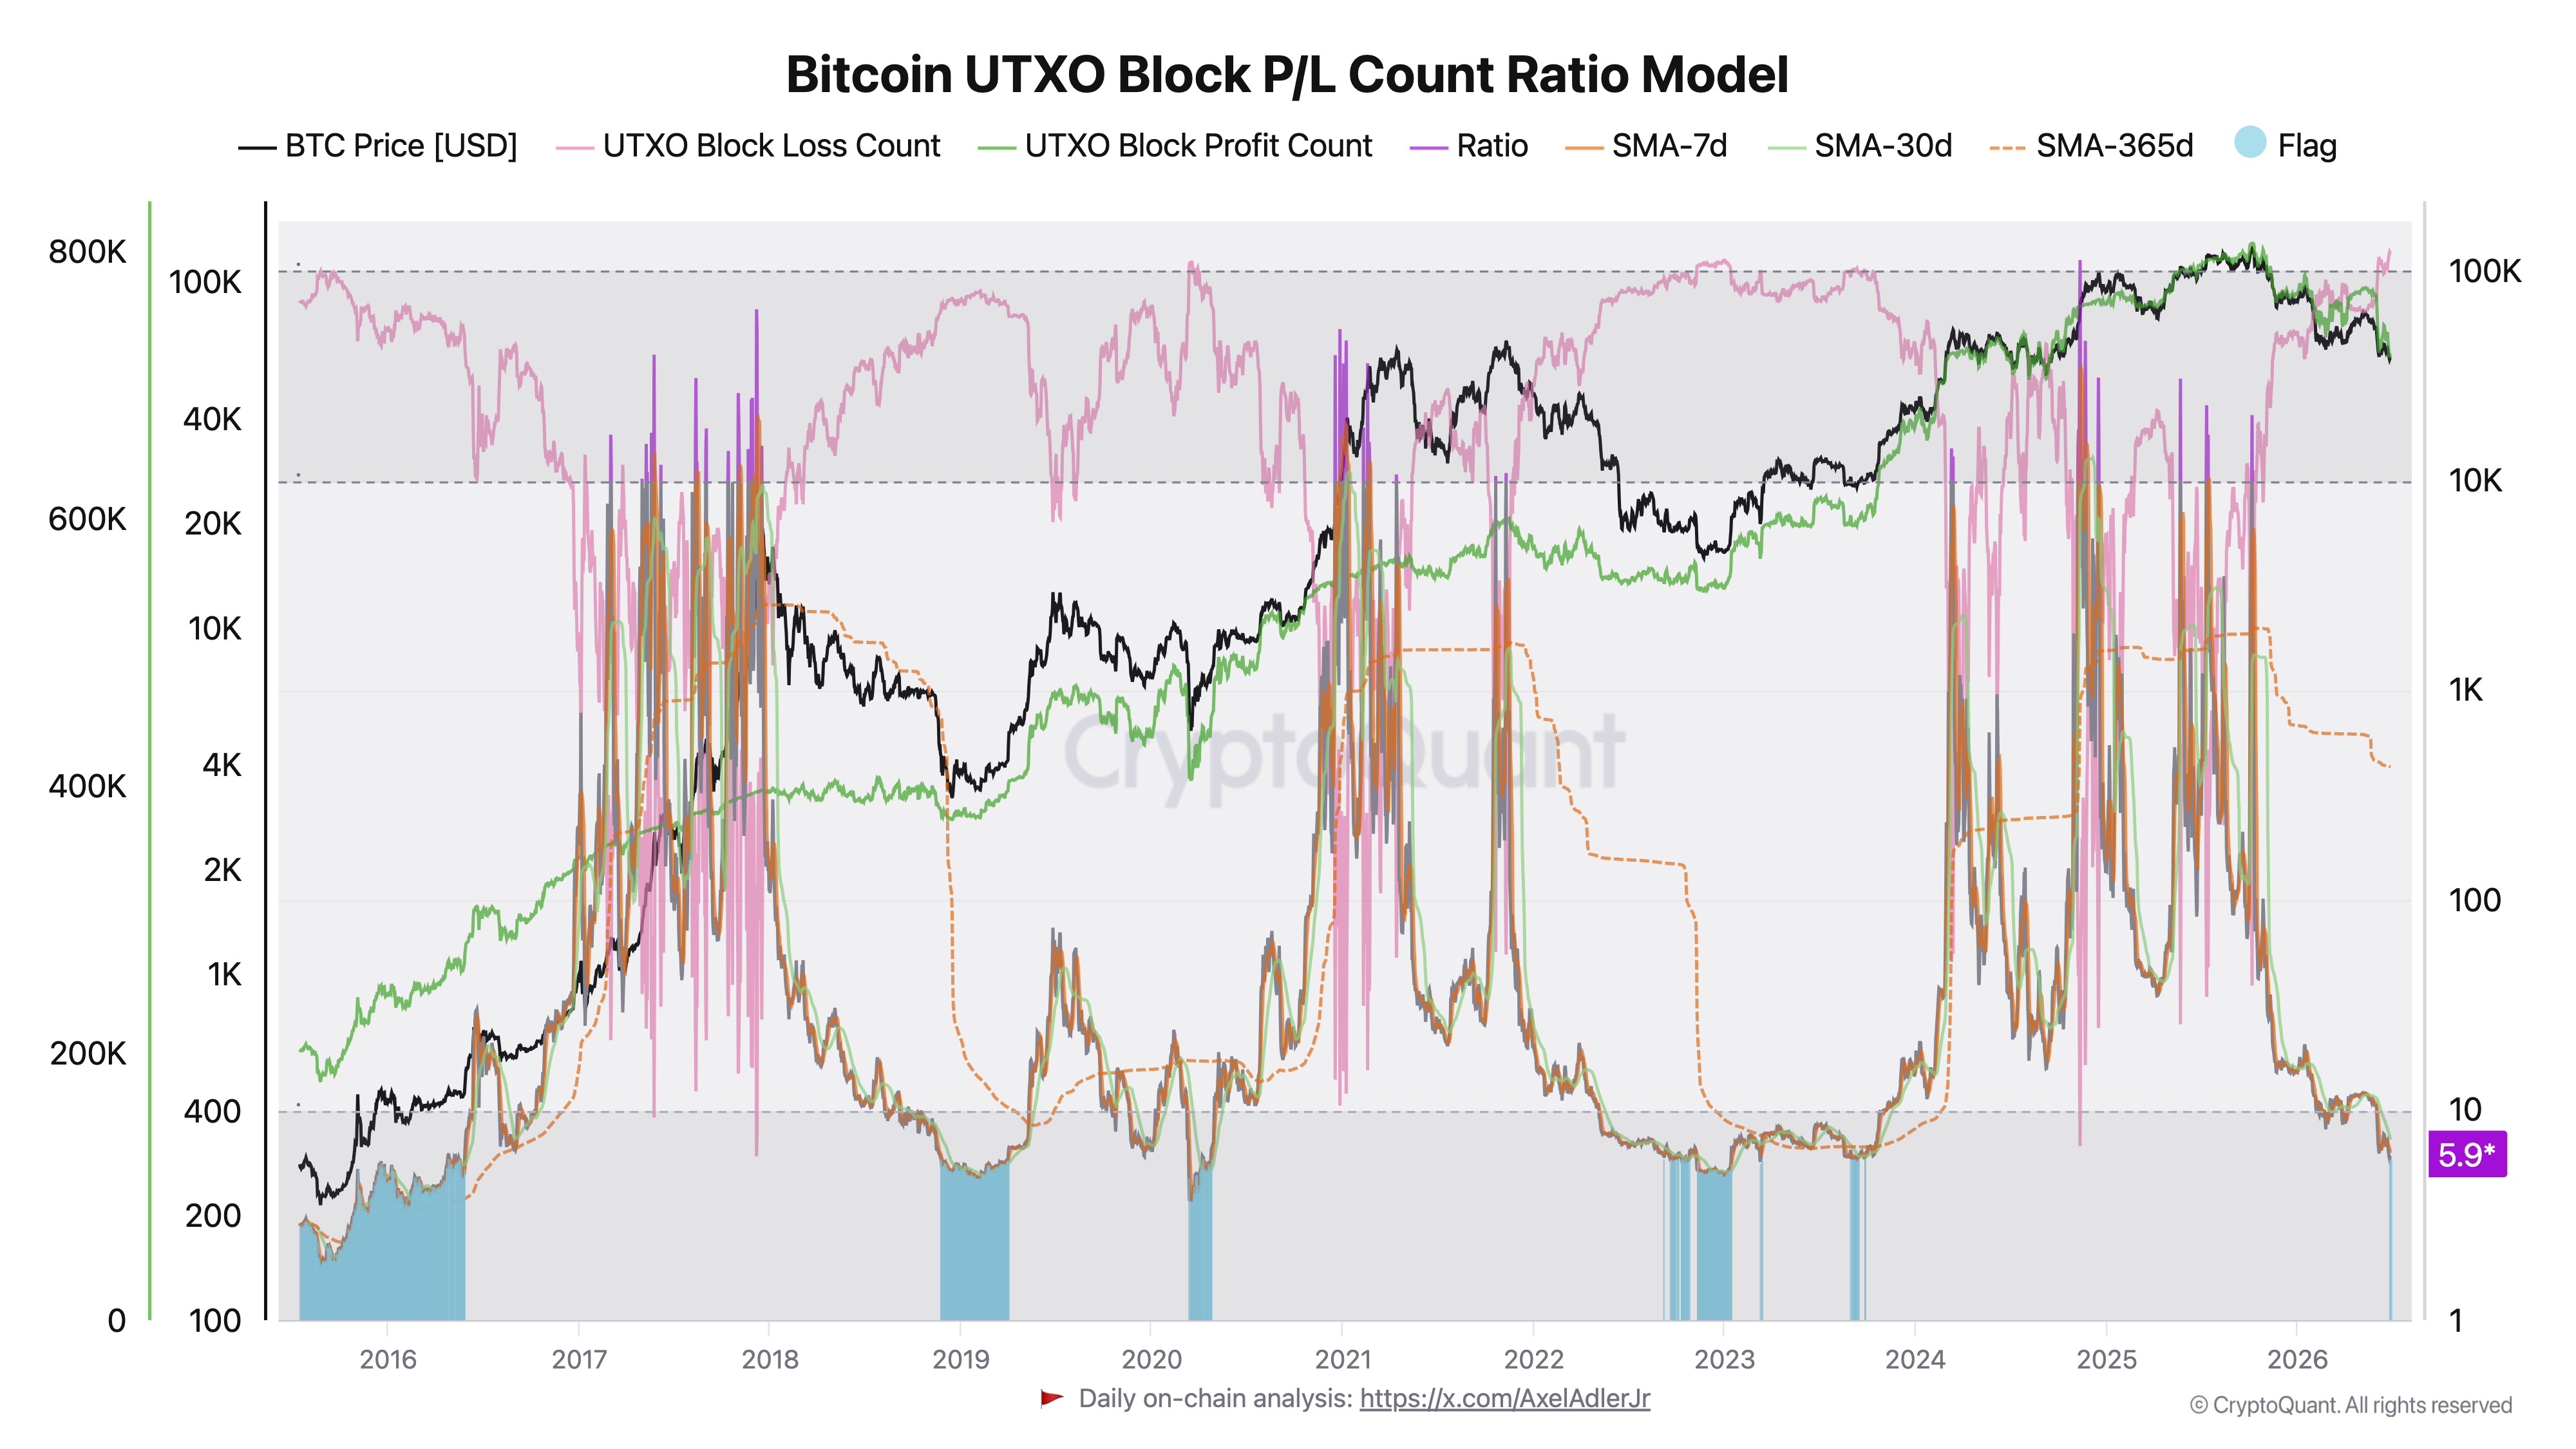
Bitcoin UTXO Block P/L Count Ratio. Source: CryptoQuant
The Ratio currently measures 5.9, marking its lowest level since 2022 and one of its lowest on record. Moreno called it “Bitcoin’s first bottoming flag” of the current bear market.
“The main takeaway is that BTC is finally showing evidence of a meaningful internal clean-up. But if history is a guide, the market may still need to absorb more stress before the bearish phase can fully exhaust itself,” he concluded.