Employment for October and monthly GDP for September, in the set of variables followed by the NBER’s BCDC:
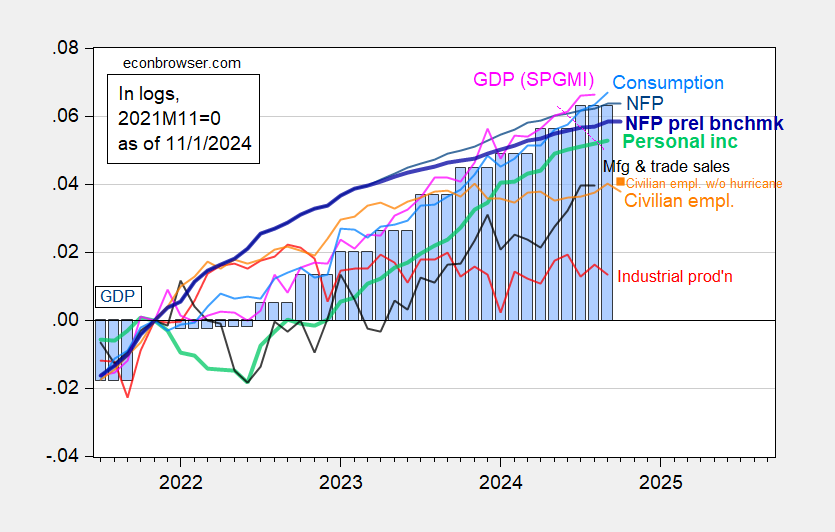
Figure 1: Nonfarm Payroll (NFP) employment from CES (blue), implied NFP from preliminary benchmark (bold blue), civilian employment (orange), civilian employment adding number of workers indicating unemployed due to weather (orange square), industrial production (red), personal income excluding current transfers in Ch.2017$ (bold light green), manufacturing and trade sales in Ch.2017$ (black), consumption in Ch.2017$ (light blue), and monthly GDP in Ch.2017$ (pink), GDP (blue bars), all log normalized to 2021M11=0. Source: BLS via FRED, Federal Reserve, BEA 2024Q3 1st release, S&P Global Market Insights (nee Macroeconomic Advisers, IHS Markit) (11/1/2024 release), and author’s calculations.
Note that adding in 41K for the strikes will not change the path much for reported NFP; however adding in 460K for the decrease d employment due to bad weather makes the household survey series (civilian employment, see orange square) look less daunting.
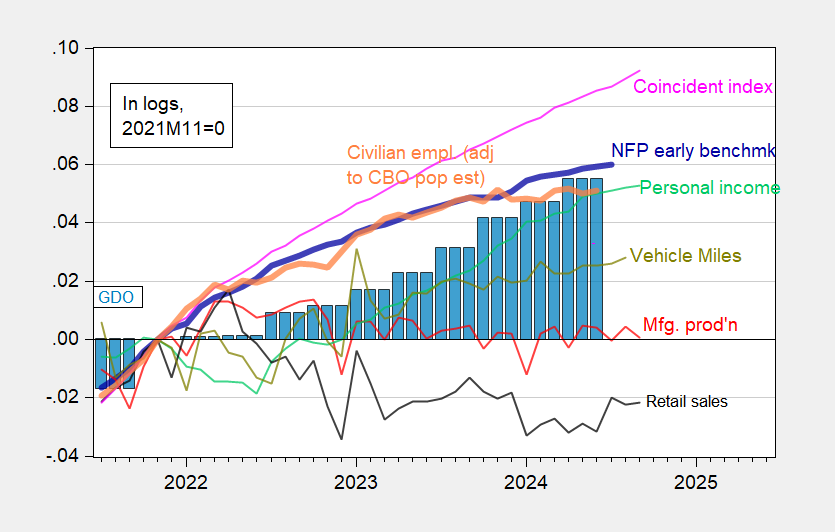
Available alternative indicators are generally up, including the coincident index for September, and vehicle miles traveled (VMT) for August.
Figure 2: Nonfarm Payroll early benchmark (NFP) (bold blue), civilian employment adjusted using CBO immigration estimates through mid-2024 (orange), manufacturing production (red), personal income excluding current transfers in Ch.2017$ (light green), retail sales in 1999M12$ (black), vehicle miles traveled (VMT) (chartreuse), and coincident index (pink), GDO (blue bars), all log normalized to 2021M11=0. Early benchmark is official NFP adjusted by ratio of early benchmark sum-of-states to CES sum of states. Source: Philadelphia Fed, Federal Reserve via FRED, BEA 2024Q2 third release/annual update, and author’s calculations.
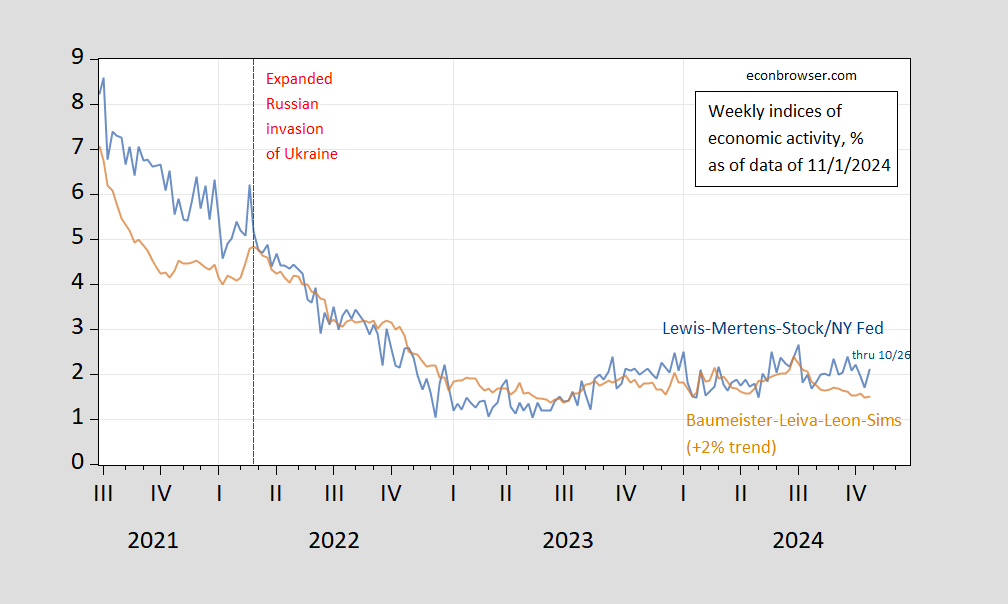
High frequency (weekly) indicators are mixed, with the Lewis-Mertens-Stock WEI at 2.1%, and the Baumeister-Leiva-Leon-Sims WECI at 1.5% (assuming trend is 2%).
Figure 3: Lewis-Mertens-Stock Weekly Economic Index (blue), and Baumeister-Leiva-Leon-Sims Weekly Economic Conditions Index for US plus 2% trend (tan), all y/y growth rate in %. Source: NY Fed via FRED, WECI, accessed 11/1/2024, and author’s calculations.
GDPNow for Q4 is at 2.3% today; NY Fed nowcast at 2.01%.
Intel is set to cut over 21,000 people, or roughly 20% of its workforce, with…
What do you like about the way you look? Last week, we asked that question,…
Wealth and health are closely intertwined, especially here in the US, where the high cost…
The odd effects of special relativity can be harnessed to build quantum computersYuichiro Chino/Getty Images…
It’s all about nature and is both simplistic and beautiful. Each puzzle is made from…
A Social Security “war room,” threats to shut the agency, worker buyouts and a restraining…